Alcohol is the biggest cause of liver disease in the UK, accounting for 6 in 10 cases of liver disease. Regularly exceeding the recommend UK alcohol guidelines increases the risk of developing liver disease and liver cancer. Alcohol-related liver disease (ArLD) has three stages, and up to 5% of people with cirrhosis will develop liver cancer:
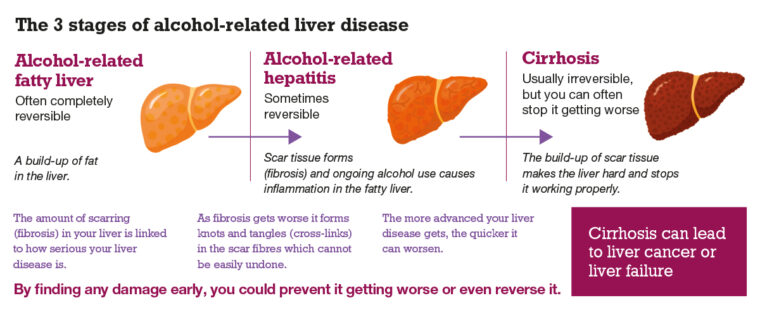
- Alcohol-related fatty liver: this is when extra fat builds up in the liver cells due to heavy drinking.
- Alcohol-related hepatitis: this is when the liver becomes inflamed due to heavy drinking, which destroys liver cells.
- Cirrhosis: this is the most advanced form of liver disease when scar tissue replaces healthy liver tissue, impairing liver function.
Alcohol and liver disease in Scotland:
*All the figures below are specific for 2023 unless specified otherwise.
- There were 18.4 chronic liver disease deaths per 100,000 population in Scotland in 2023.
- In general, chronic liver disease death rates decreased from a peak in 2003 (25.4 per 100,000 population) until 2015 (15.0 per 100,000 population). Since then it has increased slightly up to 2023 (18.4 per 100,000 population).
- Male death rates for chronic liver disease were 1.8 higher than those for females (23.5 compared to 13.3 per 100,000 population).
- Chronic liver disease death rates were highest for people aged 55-64 years (40.9 per 100,000 population). Apart from in 1991, this age group has consistently had the highest death rate for chronic liver disease.
- 77.7% of chronic liver disease deaths were due to alcoholic liver disease. The percentage of deaths associated with alcoholic liver disease increased from 1982, when it was 39.9%, to 88.4% in 2008. Since then the proportion of chronic liver disease deaths attributable to alcoholic liver disease has generally been trending downwards.
- The rate for alcoholic liver disease deaths peaked in 2003 (21.0 per 100,000 population) and then decreased to 12.1 per 100,000 population in 2015. The rate in 2023 was 14.3 per 100,000 population.
- Chronic liver disease death rates were 4.5 times higher in the most deprived areas (41.5 per 100,000 population) compared to the least deprived areas (9.3 per 100,000 population).
- The largest gap between the death rates was in 2002, when the rate in the most deprived area was 11.1 times higher than in the least deprived area.
- Chronic liver disease death rates in 2023 among mainland boards were highest in NHS Greater Glasgow & Clyde (23.6 per 100,000 population). The mainland board with the lowest death rate was NHS Grampian (13.5 per 100,000 population).
- From the peak chronic liver disease death rate for Scotland in 2003, the rate in NHS Greater Glasgow and Clyde has had the largest fall, with a 47.4% reduction in annual death rates (from 44.9 per 100,000 population to 23.6 per 100,000 population in 2023). The reduction for Scotland for the same time period was 27.6% (from 25.4 per 100,000 population in 2003 to 18.4 per 100,000 population in 2023).
Source:
Scottish Burden of Disease:
- From 2019 to 2044, the number of people with chronic liver disease in Scotland is estimated to increase by 54%, from 43,200 prevalent cases to 66,300. This equates to an additional 23,100 people living with chronic liver disease in 2044, compared to 2019.
- For females, an increase of 68% is projected, representing an absolute increase of 13,600 prevalent cases. For males, there is projected to be a 41% increase in prevalence, representing an absolute increase of 9,500 prevalent cases